井出草平の研究ノート

ω係数[R]

ω(オメガ)係数は内的整合性を確認するための指標である。近年はCronbachのαより良い方法と言われることが多い。Cronbachのαは因子構造を無視して、一次元性の検証していることが原因である。

データ

psychパッケージに含まれるIPIP-NEOのデータbfiを使用する。
このエントリでは、確証的因子分析で5因子構造のω係数の計算をする。

bfiの説明はこちら ides.hatenablog.com

library("psych")
data <- bfi[1:25]

計算

計算はsemToolsパッケージを利用する。

library(lavaan)
library(semTools)
model <- ' Agreeableness =~ A1 + A2 + A3 + A4 + A5
           Conscientiousness =~ C1 + C2 + C3 + C4 + C5
           Extraversion =~ E1 + E2 + E3 + E4 + E5
           Neuroticism =~ N1 + N2 + N3 + N4 + N5
           Openness =~ O1 + O2 + O3 + O4 + O5'
fit <- cfa(model, data = data, std.lv=T)
reliability(fit)

結果

       Agreeableness Conscientiousness Extraversion Neuroticism    Openness
alpha      0.4437533      -0.316283414  -0.65524296   0.8169469 -0.17609811
omega      0.5912043       0.005802957   0.04766026   0.8179816  0.04241799
omega2     0.5912043       0.005802957   0.04766026   0.8179816  0.04241799
omega3     0.6061009       0.004594535   0.04553222   0.8082328  0.03816464
avevar     0.3502353       0.371791388   0.40308320   0.4808678  0.24482561

5種類の出力がされる。

Cronbach's alpha

alphaはクロンバッハのαである。 f:id:iDES:20200615061147p:plain

Cronbach, L. J. (1951). Coefficient alpha and the internal structure of tests. Psychometrika, 16(3), 297–334. https://link.springer.com/article/10.1007/BF02310555

Raykov's omega

omegaとあるのはRaykov's omegaである。

f:id:iDES:20200615061219p:plain

Raykov, T. (2001). Estimation of congeneric scale reliability using covariance structure analysis with nonlinear constraints British Journal of Mathematical and Statistical Psychology, 54(2), 315-323. https://onlinelibrary.wiley.com/doi/abs/10.1348/000711001159582

bentler's omega

omega2はbentler's omegaである。
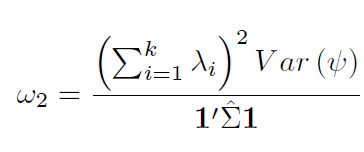
f:id:iDES:20200615061309p:plain

Bentler, P. M. (2009). Alpha, dimension-free, and model-based internal consistency reliability.Psychometrika, 74(1), 137–143. https://link.springer.com/article/10.1007/s11336-008-9100-1

McDonald's omega(1999)

omega3はMcDonald's omegaである。

f:id:iDES:20200615061414p:plain

McDonald, R. P. (1999). Test theory: A unified treatment.

注意が必要なのはMcDonald's omegaというと1978年の論文があるが、1978年と1999年のものは違うものだということである。

Roderick P. McDonald(1979). Generalizability in Factorable Domains: "Domain Validity and Generalizability" Educational and Psychological Measurement, 38(1), 75-79. https://journals.sagepub.com/doi/abs/10.1177/001316447803800111

平均分散抽出

avevarは平均分散抽出average variance extracted (AVE)である。

f:id:iDES:20200615061404p:plain

en.wikipedia.org

香川県ネット・ゲーム規制条例を主導した大山一郎議員、海外に歴史修正主義者として紹介される

ニューヨークタイムズ香川県のネット・ゲーム規制条例の記事が掲載された。

www.nytimes.com

記事では大山議員は次のように説明されている。

大山氏は超保守派で戦時中の残虐行為の社会認識を変えるために活動し、日本の教育制度に伝統的な家族の価値観を取り戻すことを提唱してきた。今回の規制ではゲームを日本の家庭を脅かすものなど、イデオロギー的な傾向が現れている。

日本では「歴史修正主義」は左が右を批判する言葉として使われるため、使いにくい言葉になってしまっている。右の人たちは「自虐史観」という言葉で自らのポジショニングを表現することが多い。

ただ、英語には「自虐史観」という言葉がないので、歴史修正主義(Revisionism / Historical Revisionism)と一括して認識されるのが一般的だ。

例えば海外では「日本の歴史修正主義者たちは自虐的な歴史の見方を非難している」という記述がされる。

Japan’s revisionists rail against ‘masochistic’ view of history(AP NEWS) https://apnews.com/7ccac195f8eb65f0845451334929f36c

ここで登場する"masochistic view of history"が「自虐史観」の英訳である。

大山議員と自虐史観

香川議会での発言では、教科書採択での質問が多い印象がある。例えば以下のもの。

2004年07月07日:平成16年6月定例会(第4日)

愛国心の欠如、その大きな要因の一つに、自虐的反日史観に立った我が国の歴史教科書のあり方に問題があると言われております http://www.db-search.com/kagawa/index.php/4772796?Template=doc-one-frame&VoiceType=OneHit&VoiceID=13639

屋外で過ごす時間と近視

屋外で過ごす時間が増えるほど近視率が減少する(抑制効果がある)。これは複数の研究でもメタアナリシスでも確認されていて、どうやら間違いなさそうだ。

pubmed.ncbi.nlm.nih.gov

小児および青年(20歳まで)の屋外で過ごした時間と近視のシステマティックレビューとメタアナリシス。

分析に使用された研究

7件の横断的研究の結果はメタアナリシスにプールされた。さらに16件の研究(メタアナリシスの基準を満たさない8件の横断的研究、7件の前向きコホート研究、1件のランダム化比較試験[RCT])がシステマティックレビューで報告された。

方法

メタアナリシスに使用されたのは7件の研究。16件の研究(メタアナリシスの基準を満たさない8件の横断的研究、7件の前向きコホート研究、1件のランダム化比較試験[RCT])が存在する。

結果

1週間に屋外で過ごす時間が1時間増えるごとに近視のオッズが2%減少する(OR、0.981;95%CI、0.973-0.990;P<0.001;I(2)、44.3%)。2%は弱い保護因子といえるだろうが、これは測定単位(一週間168時間のうち1時間)に関連していて、例えば、毎日屋外で過ごす時間を1時増やす(1週間に7時間)にすると近視のオッズ比は0.87と減少する。

f:id:iDES:20200614014135p:plain

f:id:iDES:20200614014127p:plain

結論

屋外で過ごす時間を増やすことは、子供や青少年の近視発症とその進行のリスクを減らすための単純な戦略である可能性がある。

メタアナリシスに使用された研究

  • Deng L, Gwiazda J, Thorn F. Children’s refractions and visualactivities in the school year and summer. Optom Vis Sci2010;87:406 –13.
  • Dirani M, Tong L, Gazzard G, et al. Outdoor activity andmyopia in Singapore teenage children. Br J Ophthalmol 2009;93:997–1000.
  • Ip JM, Saw SM, Rose KA, et al. Role of near work in myopia:findings in a sample of Australian school children. InvestOphthalmol Vis Sci 2008;49:2903–10.
  • Khader YS, Batayha WQ, Abdul-Aziz SM, Al-Shiekh-KhalilMI. Prevalence and risk indicators of myopia among school-children in Amman, Jordan. East Mediterr Health J 2006;12:434 –9.
  • Low W, Dirani M, Gazzard G, et al. Family history, nearwork, outdoor activity, and myopia in Singapore Chinesepreschool children. Br J Ophthalmol 2010;94:1012– 6.
  • Lu B, Congdon N, Liu X, et al. Associations between nearwork, outdoor activity, and myopia among adolescent studentsin rural China: the Xichang Pediatric Refractive Error Studyreport no. 2. Arch Ophthalmol 2009;127:769 –75.
  • Mutti DO, Mitchell GL, Moeschberger ML, et al. Parentalmyopia, near work, school achievement, and children’s refrac-tive error. Invest Ophthalmol Vis Sci 2002;43:3633– 40.

多変量分散分析(Multiple ANOVA)[R]

以下の本のMANOVAの項目から。

MANOVA

ANOVAが複数標本のためのt-検定の一般化であることはすでに説明した。一方、t-検定は、1つの変数だけで動作するように設計されており、複数の変数がある場合は、Hotelling のT平方検定を使用する必要がある。ANOVAを拡張して、複数の変数で動作させることは可能だろうか?答えはイエスで、そのための手法はMANOVA (Multiple ANOVA)と呼ばれている。MANOVAの仮定は、2つの標本についてHotellingのT平方検定を使用するときの仮定と似ている。ループ間の共分散行列が等しく、データは各グループについて多変量ガウス分布から来ていなければならず、外れ値があってはならない。 この例では、任意の共分散行列を持つ多変量ガウス分布(3つの変数)からデータを生成する。3つのクラス(各クラスには50人の学生がいる)の歴史、数学、生物学の成績を表す列の名前を割り当てる。もちろん、実際の演習では、データを受け取ることになるので、自分でデータを作成することはない。このシミュレーンで作成されたデータセットをここで使用する理由は、真のパラメータがわかっている管理された環境でMANOVA検定を行いたいからだ。

準備

この方法ではMASSパッケージを使う。通常のinstall.packages()コマンドでインストールできる。

方法

まず、MASSライブラリをロードし、以下のように3×3の共分散行列オブジェクトを生成する。

library(MASS)
f = matrix(c(2,1,1,1,2,1,1,1,2),3,3)

結果。

     [,1] [,2] [,3]
[1,]    2    1    1
[2,]    1    2    1
[3,]    1    1    2

mvrnorm関数を用いて3つのデータセットを生成するが、すべて同じ共分散行列オブジェクトを共有する。第1引数は生成したいサンプル数、第2引数は平均値のベクトル、第3引数は共分散行列オブジェクトである。

x1 = mvrnorm(50,c(10,10,10),f)
x1 = cbind(x1,1)
x2 = mvrnorm(50,c(10,10,10),f)
x2 = cbind(x2,2)
x3 = mvrnorm(50,c(30,10,10),f)
x3 = cbind(x3,3)

これが学校からのデータだとする。変数に名前を割り当てる(これは、後で参照する方法を簡単にするためのもので、学校には歴史、数学、生物学の3つのクラスがあるあるとする。)

total_data = data.frame(rbind(x1,x2,x3))
colnames(total_data) = c("History","Math","Biology","class")

MASSパッケージからmanova関数を呼び出す。

result = manova(cbind(History,Math,Biology) ~ class,data=total_data)
summary(result)

前述のコードは、MANOVA検定統計の以下の出力を生成する。

Show in New WindowClear OutputExpand/Collapse Output
           Df  Pillai approx F num Df den Df    Pr(>F)    
class       1 0.74225   140.15      3    146 < 2.2e-16 ***
Residuals 148                                             
---
Signif. codes:  0 ‘***’ 0.001 ‘**’ 0.01 ‘*’ 0.05 ‘.’ 0.1 ‘ ’ 1

p値は非常に小さいので、3つのグループの平均ベクトルが同じであるという帰無仮説を棄却する(最初のグループは平均値(10,10,10,10)、2番目のグループは平均値(10,10,10,10)、3番目のグループは平均値(30,10,10,10))。 summary.aov関数を使用すると、ベクトルのどの成分が違いをもたらしているかを見つけることができる(もちろん、最初の成分であるHistoryであることはわかっている)。

summary.aov(result)

結果。

 Response History :
             Df Sum Sq Mean Sq F value    Pr(>F)    
class         1 9805.3  9805.3  404.78 < 2.2e-16 ***
Residuals   148 3585.1    24.2                      
---
Signif. codes:  0 ‘***’ 0.001 ‘**’ 0.01 ‘*’ 0.05 ‘.’ 0.1 ‘ ’ 1

 Response Math :
             Df  Sum Sq Mean Sq F value Pr(>F)
class         1   4.782  4.7816  2.4059  0.123
Residuals   148 294.142  1.9874               

 Response Biology :
             Df Sum Sq Mean Sq F value Pr(>F)
class         1   5.01  5.0096  2.5299 0.1138
Residuals   148 293.06  1.9801

歴史だけが有意であることがわかる。

lavaanパッケージを用いて階層因子分析を推定する[R]

階層因子分析(hierarchical factor analysis)について松田淑美・狩野裕「高次因子分析モデルと階層因子分析モデルについて」から説明を引用しよう。

http://www.sigmath.es.osaka-u.ac.jp/~kano/research/meeting/20050827_BSJ33/matsudaABS.pdf

階層因子分析モデルは,全ての観測変数を説明する一般因子(general factor)と,一部の観測変数を説明するグループ因子(group factor)からなる.このモデルには,いくつかの「層 (layer)」があり,各層において,観測変数は,ひとつの因子に負荷する.層の順番は,各層に含まれる因子の数によって決まり,因子数の最も多い層が第1 層となる.図 2のモデルでは,F1 ∼ F4 が第 1 層,F5 ∼ F6 が第2層,Gが第3層となる.また,F1 ∼ F6がグループ因子,G が一般因子である.これらの因子は全て,互いに直交している.

f:id:iDES:20200613005426p:plain

特に,2 層のモデル(ひとつの一般因子といくつかのグループ因子からなるモデル)は双因子モデル(bi–factor model)とも言う(図 3).

f:id:iDES:20200613005439p:plain

データ

lavaanパッケージに同梱されているHolzingerSwineford1939を使用する。

ドキュメントには次のようにデータの説明が書かれてある。

古典的なHolzinger and Swineford (1939)のデータセットは、2つの異なる学校(PasteurとGrant-White)の7年生と8年生の子供たちの精神能力テストのスコアで構成されている。オリジナルのデータセット(MBESSパッケージで利用可能)には、26のテストのスコアがある。しかし、9つの変数を持つより小さなサブセットが、文献ではより広く使われている(たとえば、Joreskogの1969年の論文では、Grant-Whiteの学校からの145人の被験者のみを使用している)。

  • x1 Visual perception
  • x2 Cubes
  • x3 Lozenges
  • x4 Paragraph comprehension
  • x5 Sentence completion
  • x6 Word meaning
  • x7 Speeded addition
  • x8 Speeded counting of dots
  • x9 Speeded discrimination straight and curved capitals

因子

visual textual speed
Visual perception Paragraph comprehension Speeded addition
Cubes Sentence completion Speeded counting of dots
Lozenges Word meaning Speeded discrimination straight and curved capitals

モデル

すべての観測変数に共通して影響を与える構成概念として「知能(intelligence)」を想定する。 この一般因子とグループ因子との聞の相関は,あらかじめ0に固定する。

library(lavaan)
HS1.model <- 'visual =~ x1 + x2 + x3
             textual =~ x4 + x5 + x6
             speed =~ x7 + x8 + x9
             intelligence =~ x1 + x2 + x3 + x4 + x5 + x6 + x7 + x8 + x9
             intelligence ~~ 0*visual + 0*textual + 0*speed'

実行

HS1.fit <- sem(HS2.model, data = HolzingerSwineford1939, std.lv=T)
summary(HS1.fit, standardized=TRUE) 

分散

Variances:
                   Estimate  Std.Err  z-value  P(>|z|)   Std.lv  Std.all
   .x1                0.395    0.214    1.848    0.065    0.395    0.290
   .x2                1.155    0.116    9.944    0.000    1.155    0.836
   .x3               -0.079    1.656   -0.048    0.962   -0.079   -0.062
   .x4                0.386    0.048    8.122    0.000    0.386    0.286
   .x5                0.383    0.061    6.233    0.000    0.383    0.230
   .x6                0.371    0.042    8.732    0.000    0.371    0.310
   .x7                0.654    0.099    6.604    0.000    0.654    0.552
   .x8                0.453    0.085    5.318    0.000    0.453    0.444
   .x9                0.578    0.062    9.337    0.000    0.578    0.569

x3の分散がマイナスになっている。これは不適解であるため、x3にも制約を課す必要がある。

モデルの改善

library(lavaan)
HS2.model <- 'visual =~ x1 + x2 + x3
             textual =~ x4 + x5 + x6
             speed =~ x7 + x8 + x9
             intelligence =~ x1 + x2 + x3 + x4 + x5 + x6 + x7 + x8 + x9
             intelligence ~~ 0*visual + 0*textual + 0*speed
             x3 ~~ a*x3; a>0'

実行

HS2.fit <- sem(HS2.model, data = HolzingerSwineford1939, std.lv=T)
summary(HS2.fit, standardized=TRUE) 

結果。

  Estimator                                         ML
  Optimization method                           NLMINB
  Number of free parameters                         30
  Number of inequality constraints                   1
                                                      
  Number of observations                           301
                                                      
Model Test User Model:
                                                      
  Test statistic                                26.016
  Degrees of freedom                                15
  P-value (Chi-square)                           0.038

Parameter Estimates:

  Standard errors                             Standard
  Information                                 Expected
  Information saturated (h1) model          Structured

Latent Variables:
                   Estimate  Std.Err  z-value  P(>|z|)   Std.lv  Std.all
  visual =~                                                             
    x1               -0.251    0.200   -1.255    0.209   -0.251   -0.216
    x2                0.084    0.094    0.891    0.373    0.084    0.071
    x3                0.779    0.123    6.320    0.000    0.779    0.690
  textual =~                                                            
    x4                0.868    0.065   13.256    0.000    0.868    0.747
    x5                1.058    0.066   15.930    0.000    1.058    0.821
    x6                0.790    0.063   12.620    0.000    0.790    0.722
  speed =~                                                              
    x7                0.722    0.080    9.019    0.000    0.722    0.664
    x8                0.706    0.075    9.469    0.000    0.706    0.698
    x9                0.465    0.064    7.300    0.000    0.465    0.461
  intelligence =~                                                       
    x1                0.949    0.097    9.810    0.000    0.949    0.814
    x2                0.472    0.073    6.433    0.000    0.472    0.402
    x3                0.817    0.127    6.460    0.000    0.817    0.724
    x4                0.460    0.094    4.891    0.000    0.460    0.396
    x5                0.397    0.104    3.835    0.000    0.397    0.308
    x6                0.449    0.088    5.092    0.000    0.449    0.411
    x7                0.097    0.070    1.377    0.169    0.097    0.089
    x8                0.264    0.066    3.985    0.000    0.264    0.261
    x9                0.471    0.067    7.082    0.000    0.471    0.468

Covariances:
                   Estimate  Std.Err  z-value  P(>|z|)   Std.lv  Std.all
  visual ~~                                                             
    intelligence      0.000                               0.000    0.000
  textual ~~                                                            
    intelligence      0.000                               0.000    0.000
  speed ~~                                                              
    intelligence      0.000                               0.000    0.000
  visual ~~                                                             
    textual          -0.240    0.094   -2.566    0.010   -0.240   -0.240
    speed            -0.002    0.094   -0.021    0.983   -0.002   -0.002
  textual ~~                                                            
    speed             0.122    0.083    1.473    0.141    0.122    0.122

Variances:
                   Estimate  Std.Err  z-value  P(>|z|)   Std.lv  Std.all
   .x3         (a)   -0.000                              -0.000   -0.000
   .x1                0.394    0.216    1.822    0.068    0.394    0.290
   .x2                1.152    0.098   11.799    0.000    1.152    0.834
   .x4                0.386    0.048    8.120    0.000    0.386    0.286
   .x5                0.383    0.061    6.252    0.000    0.383    0.231
   .x6                0.371    0.042    8.731    0.000    0.371    0.310
   .x7                0.653    0.099    6.620    0.000    0.653    0.552
   .x8                0.454    0.085    5.357    0.000    0.454    0.444
   .x9                0.577    0.060    9.582    0.000    0.577    0.569
    visual            1.000                               1.000    1.000
    textual           1.000                               1.000    1.000
    speed             1.000                               1.000    1.000
    intellignc        1.000                               1.000    1.000

Constraints:
                                               |Slack|
    a - 0                                        0.000

パス図の描画

library(semPlot)
semPaths(HS2.fit,layout="spring",
whatLabels="stand",sizeMan=5,
shapeLat="ellipse",sizeLat=8,sizeLat2=5,
exoCov=F,residuals=F,nCharNodes=0,
edge.label.cex=0.9,edge.color="black")

f:id:iDES:20200613010114p:plain

VRで近視になることはない

www.nature.com

VRヘッドマウントディスプレイの長期使用が近視の原因になるか? ということが検討されている論文。

VRで想定される近視のリスク

ニアワーク(近接作業)

pubmed.ncbi.nlm.nih.gov pubmed.ncbi.nlm.nih.gov

顕微鏡の職業的使用は成人の近視に関連

pubmed.ncbi.nlm.nih.gov pubmed.ncbi.nlm.nih.gov

近視の発生と進行に重要な要因として考えられるもの

環境光量

pubmed.ncbi.nlm.nih.gov

両眼の状態

pubmed.ncbi.nlm.nih.gov

末梢網膜の屈折状態

pubmed.ncbi.nlm.nih.gov

これらはVRを使用するときに関連する項目である。

方法

現実世界と仮想世界および、屋内と屋外の環境で40分間の試行を行った後の両眼状態を比較した。眼球成長と近視発達のシグナルが存在する可能性を評価するために、眼脈絡膜の厚さの変化を測定した。

結果

その結果、4つの環境に曝露しても、遠方と近方の両眼姿勢、視線の安定性、収容の振幅、立体視の変化は変わらなかった。VRは眼の両眼状態に悪影響を及ぼすことは確認できなかった。

脈絡膜の厚さはどちらの実世界でも変化しなかったが、VRトライアルの後に有意な肥厚(約10ミクロン)があった(p < 0.001)。

議論

脈絡膜が厚くなることは目にとって悪いように思えるかもしれないが、子どもの近視の進行を抑制することがわかっている。VRは視聴距離が短いためニアワーク(近接作業)のようにも思えるが、近視を誘発する刺激は確認できなかった。

ただ、この研究は若年成人を対象としたもので、子どもにも同じことがいえるかはわからない。子供は瞳孔距離が小さい傾向があり、大人用にセッティングされたVRが、悪影響を及ぼさないかはまだわからない。

雑感

スクリーンが近くにあっても、遠くを見ているため、ニアワーク(近接作業)にはならないため、近視にはつながらないのだろう。

一時期VRで視力が回復したということが話題になった。

真性ではない仮性近視であれば回復するのではないか?という指摘もある。

www.excite.co.jp

lavaanパッケージを用いて二次因子分析モデルを推定する[R]

二次因子分析モデル(second order factor analysis)とは「斜交解による通常の因子分析の結果,因子聞に強い相闘が観察されたときには,それらの因子に共通して影響を与える上位の因子を想定することができます。このように,通常の因子分析における複数の因子を,さらに少数の因子で説明するモデル」のことである(豊田秀樹『共分散構造分析[R編]』p.56)。

ここではIQの基本的な概念を作成したThurstone & Thurstone (1941)の例を使ってみたい。

Thurstone, L. L., & Thurstone, T. G. (1941), Factorial studies of intelligence https://psycnet.apa.org/record/1941-03743-001

Thurstone & Thurstone (1941)の知能の構造

Verbal Comprehension, Word Fluency Reasoning
Sentences First.Letters Letter.Series
Vocabulary 4.Letter.Words Pedigrees
Sent.Completion Suffixes letter.Group

二次因子分析モデル

下記のようなモデルである。

f:id:iDES:20200612174113p:plain

因子分析モデルではモデルの識別のため以下の3つの方法があり、どれかの方法を選択しなければならない。

  1. 各構成概念について複数の観測変数あるいは下位の因子に刺さるパス(因子負荷量)のうち任意の1つを1に固定する
  2. 当該構成概念が外生変数ならばその分散を1に固定する
  3. 当該構成概念が内生変数ならばその残差の分散を1に固定する

semコマンドのデフォルトは既定値としてパスを1に固定する方法が選ばれる。 引数としてstd.lv=TRUEを入れると、外生変数である2次因子の分散および,内生変数である1次因子の残差分散を1に固定できる。

いずれの制約の置き方でも標準化解は一致する。

データの入力

library(lavaan)
VCM <- '
1
.828  1
.776  .779  1
.439  .493  .46   1
.432  .464  .425  .674  1
.447  .489  .443  .59   .541   1
.447  .432  .401  .381  .402   .288  1
.541  .537  .534  .35   .367   .32   .555  1
.38   .358  .359  .424  .446   .325  .598  .452   1'

Thurstone.cov <- getCov(VCM, names = c(
  "Sentences", "Vocabulary", "Sent.Completion",
  "First.Letters", "four.Letter.Words","Suffixes",
  "Letter.Series","Pedigrees", "Letter.Group"))

モデルの作成

model<- 'verbal.Comprehension=~ Sentences + Vocabulary + Sent.Completion
         Word.Fluency =~ First.Letters + four.Letter.Words + Suffixes
         Reasoning =~ Letter.Series + Pedigrees + Letter.Group
         intelligence =~ verbal.Comprehension + Word.Fluency + Reasoning'

分析

fit <- sem(model, 
           sample.cov = Thurstone.cov, std.lv=TRUE,
           sample.nobs = 213)
summary(fit, standardized = TRUE)

結果

lavaan 0.6-6 ended normally after 36 iterations

  Estimator                                         ML
  Optimization method                           NLMINB
  Number of free parameters                         21
                                                      
  Number of observations                           213
                                                      
Model Test User Model:
                                                      
  Test statistic                                38.376
  Degrees of freedom                                24
  P-value (Chi-square)                           0.032

Parameter Estimates:

  Standard errors                             Standard
  Information                                 Expected
  Information saturated (h1) model          Structured

Latent Variables:
                          Estimate  Std.Err  z-value  P(>|z|)   Std.lv  Std.all
  verbal.Comprehension =~                                                      
    Sentences                0.514    0.063    8.206    0.000    0.903    0.905
    Vocabulary               0.519    0.063    8.228    0.000    0.912    0.914
    Sent.Completin           0.486    0.061    8.034    0.000    0.854    0.856
  Word.Fluency =~                                                              
    First.Letters            0.520    0.061    8.554    0.000    0.834    0.836
    four.Lttr.Wrds           0.496    0.059    8.441    0.000    0.795    0.797
    Suffixes                 0.437    0.056    7.847    0.000    0.701    0.703
  Reasoning =~                                                                 
    Letter.Series            0.451    0.066    6.874    0.000    0.779    0.781
    Pedigrees                0.416    0.062    6.729    0.000    0.718    0.720
    Letter.Group             0.407    0.061    6.664    0.000    0.702    0.703
  intelligence =~                                                              
    verbl.Cmprhnsn           1.444    0.256    5.641    0.000    0.822    0.822
    Word.Fluency             1.254    0.211    5.946    0.000    0.782    0.782
    Reasoning                1.407    0.268    5.243    0.000    0.815    0.815

Variances:
                   Estimate  Std.Err  z-value  P(>|z|)   Std.lv  Std.all
   .Sentences         0.181    0.028    6.388    0.000    0.181    0.181
   .Vocabulary        0.164    0.028    5.953    0.000    0.164    0.165
   .Sent.Completin    0.266    0.033    8.026    0.000    0.266    0.267
   .First.Letters     0.300    0.051    5.923    0.000    0.300    0.302
   .four.Lttr.Wrds    0.363    0.052    6.941    0.000    0.363    0.365
   .Suffixes          0.504    0.059    8.513    0.000    0.504    0.506
   .Letter.Series     0.388    0.059    6.594    0.000    0.388    0.390
   .Pedigrees         0.479    0.062    7.751    0.000    0.479    0.481
   .Letter.Group      0.503    0.063    7.995    0.000    0.503    0.505
   .verbl.Cmprhnsn    1.000                               0.324    0.324
   .Word.Fluency      1.000                               0.389    0.389
   .Reasoning         1.000                               0.336    0.336
    intelligence      1.000                               1.000    1.000

パス図の描画

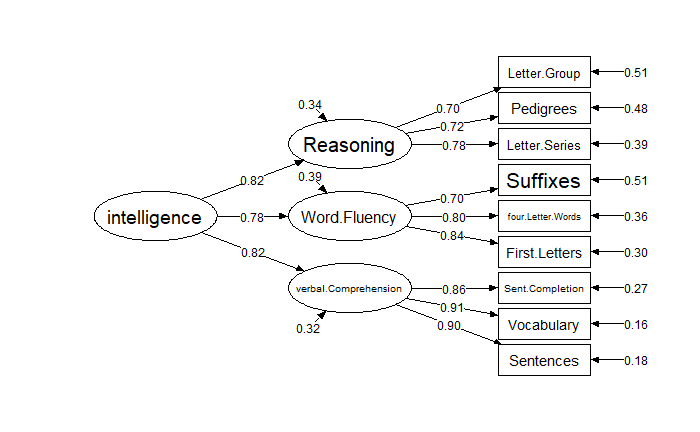
semPlotパッケージで作図しておこう。

library(semPlot)
semPaths(fit,layout="tree",whatLabels="stand", 
edge.color="black",sizeMan=9, edge.label.cex=0.9,
shapeLat="ellipse",sizeLat=15, sizeLat2=8,
style="lisrel", optimizeLatRes=T, nCharNodes=0)