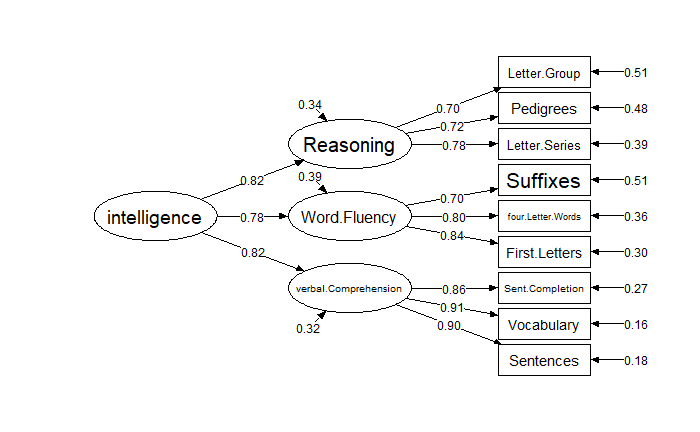
二次因子分析モデル(second order factor analysis)とは「斜交解による通常の因子分析の結果,因子聞に強い相闘が観察されたときには,それらの因子に共通して影響を与える上位の因子を想定することができます。このように,通常の因子分析における複数の因子を,さらに少数の因子で説明するモデル」のことである(豊田秀樹『共分散構造分析[R編]』p.56)。
ここではIQの基本的な概念を作成したThurstone & Thurstone (1941)の例を使ってみたい。
Thurstone, L. L., & Thurstone, T. G. (1941), Factorial studies of intelligence https://psycnet.apa.org/record/1941-03743-001
Thurstone & Thurstone (1941)の知能の構造
| Verbal Comprehension, | Word Fluency | Reasoning |
|---|---|---|
| Sentences | First.Letters | Letter.Series |
| Vocabulary | 4.Letter.Words | Pedigrees |
| Sent.Completion | Suffixes | letter.Group |
二次因子分析モデル
下記のようなモデルである。

因子分析モデルではモデルの識別のため以下の3つの方法があり、どれかの方法を選択しなければならない。
- 各構成概念について複数の観測変数あるいは下位の因子に刺さるパス(因子負荷量)のうち任意の1つを1に固定する
- 当該構成概念が外生変数ならばその分散を1に固定する
- 当該構成概念が内生変数ならばその残差の分散を1に固定する
semコマンドのデフォルトは既定値としてパスを1に固定する方法が選ばれる。
引数としてstd.lv=TRUEを入れると、外生変数である2次因子の分散および,内生変数である1次因子の残差分散を1に固定できる。
いずれの制約の置き方でも標準化解は一致する。
データの入力
library(lavaan)
VCM <- '
1
.828  1
.776  .779  1
.439  .493  .46   1
.432  .464  .425  .674  1
.447  .489  .443  .59   .541   1
.447  .432  .401  .381  .402   .288  1
.541  .537  .534  .35   .367   .32   .555  1
.38   .358  .359  .424  .446   .325  .598  .452   1'

Thurstone.cov <- getCov(VCM, names = c(
  "Sentences", "Vocabulary", "Sent.Completion",
  "First.Letters", "four.Letter.Words","Suffixes",
  "Letter.Series","Pedigrees", "Letter.Group"))
モデルの作成
model<- 'verbal.Comprehension=~ Sentences + Vocabulary + Sent.Completion
         Word.Fluency =~ First.Letters + four.Letter.Words + Suffixes
         Reasoning =~ Letter.Series + Pedigrees + Letter.Group
         intelligence =~ verbal.Comprehension + Word.Fluency + Reasoning'
分析
fit <- sem(model,
           sample.cov = Thurstone.cov, std.lv=TRUE,
           sample.nobs = 213)
summary(fit, standardized = TRUE)
結果
lavaan 0.6-6 ended normally after 36 iterations

  Estimator                                         ML
  Optimization method                           NLMINB
  Number of free parameters                         21

  Number of observations                           213

Model Test User Model:

  Test statistic                                38.376
  Degrees of freedom                                24
  P-value (Chi-square)                           0.032

Parameter Estimates:

  Standard errors                             Standard
  Information                                 Expected
  Information saturated (h1) model          Structured

Latent Variables:
                          Estimate  Std.Err  z-value  P(>|z|)   Std.lv  Std.all
  verbal.Comprehension =~
    Sentences                0.514    0.063    8.206    0.000    0.903    0.905
    Vocabulary               0.519    0.063    8.228    0.000    0.912    0.914
    Sent.Completin           0.486    0.061    8.034    0.000    0.854    0.856
  Word.Fluency =~
    First.Letters            0.520    0.061    8.554    0.000    0.834    0.836
    four.Lttr.Wrds           0.496    0.059    8.441    0.000    0.795    0.797
    Suffixes                 0.437    0.056    7.847    0.000    0.701    0.703
  Reasoning =~
    Letter.Series            0.451    0.066    6.874    0.000    0.779    0.781
    Pedigrees                0.416    0.062    6.729    0.000    0.718    0.720
    Letter.Group             0.407    0.061    6.664    0.000    0.702    0.703
  intelligence =~
    verbl.Cmprhnsn           1.444    0.256    5.641    0.000    0.822    0.822
    Word.Fluency             1.254    0.211    5.946    0.000    0.782    0.782
    Reasoning                1.407    0.268    5.243    0.000    0.815    0.815

Variances:
                   Estimate  Std.Err  z-value  P(>|z|)   Std.lv  Std.all
   .Sentences         0.181    0.028    6.388    0.000    0.181    0.181
   .Vocabulary        0.164    0.028    5.953    0.000    0.164    0.165
   .Sent.Completin    0.266    0.033    8.026    0.000    0.266    0.267
   .First.Letters     0.300    0.051    5.923    0.000    0.300    0.302
   .four.Lttr.Wrds    0.363    0.052    6.941    0.000    0.363    0.365
   .Suffixes          0.504    0.059    8.513    0.000    0.504    0.506
   .Letter.Series     0.388    0.059    6.594    0.000    0.388    0.390
   .Pedigrees         0.479    0.062    7.751    0.000    0.479    0.481
   .Letter.Group      0.503    0.063    7.995    0.000    0.503    0.505
   .verbl.Cmprhnsn    1.000                               0.324    0.324
   .Word.Fluency      1.000                               0.389    0.389
   .Reasoning         1.000                               0.336    0.336
    intelligence      1.000                               1.000    1.000
パス図の描画
semPlotパッケージで作図しておこう。
library(semPlot)
semPaths(fit,layout="tree",whatLabels="stand",
edge.color="black",sizeMan=9, edge.label.cex=0.9,
shapeLat="ellipse",sizeLat=15, sizeLat2=8,
style="lisrel", optimizeLatRes=T, nCharNodes=0)