時系列データのグラフィックを目的に作られたTSstudioパッケージを紹介しよう。TSはTime Seriesの略だろう。
TSstudioパッケージの中にUSgasという天然ガスの消費のデータが入っている。
library(TSstudio)
data(USgas)
このような感じのデータである。
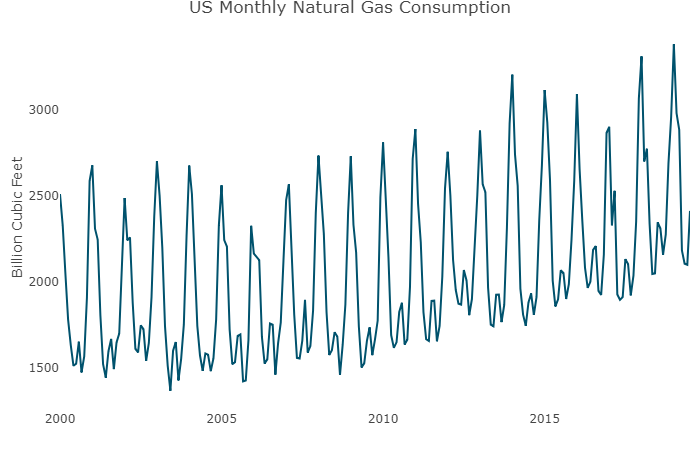
月間消費量である。暖房に使うためか、冬場に高くなる特徴がある。
        Jan    Feb    Mar    Apr    May    Jun    Jul    Aug    Sep    Oct    Nov    Dec
2000 2510.5 2330.7 2050.6 1783.3 1632.9 1513.1 1525.6 1653.1 1475.0 1567.8 1908.5 2587.5
2001 2677.0 2309.5 2246.6 1807.2 1522.4 1444.4 1598.1 1669.2 1494.1 1649.1 1701.0 2120.2
2002 2487.6 2242.4 2258.4 1881.0 1611.5 1591.4 1748.4 1725.7 1542.2 1645.9 1913.6 2378.9
2003 2700.5 2500.3 2197.9 1743.5 1514.7 1368.4 1600.5 1651.6 1428.6 1553.2 1753.6 2263.7
2000年1月から2019年7月までのデータが含まれている。
年次推移プロット
ts_plot(USgas,
        title = "US Monthly Natural Gas Consumption",
        Ytitle = "Billion Cubic Feet")
季節推移プロット
ts_seasonal(USgas, type = "all")
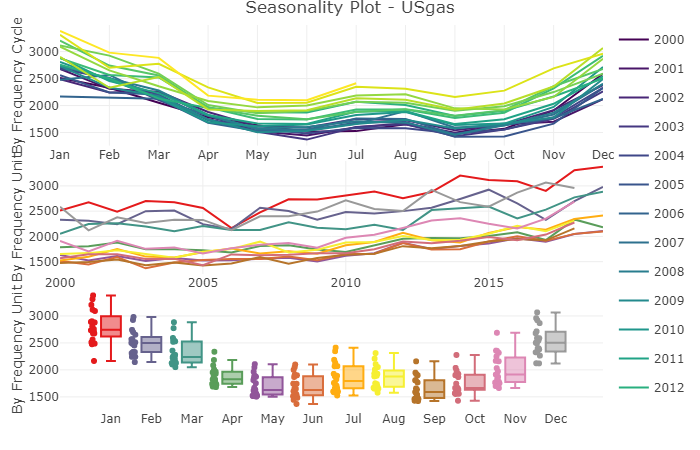
タイプは"normal"、"cycle"、"box"の3つ。今回は"all"を指定して3つとも表示させている。
ヒートマップ
ts_heatmap(USgas, title = "US Monthly Natural Gas Consumption - Heat-map")
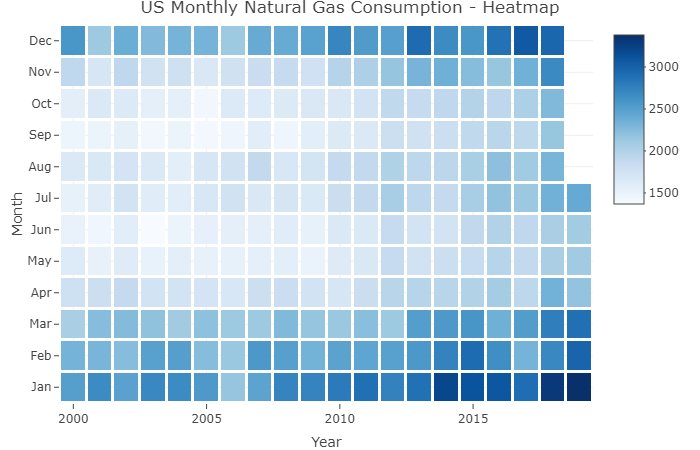
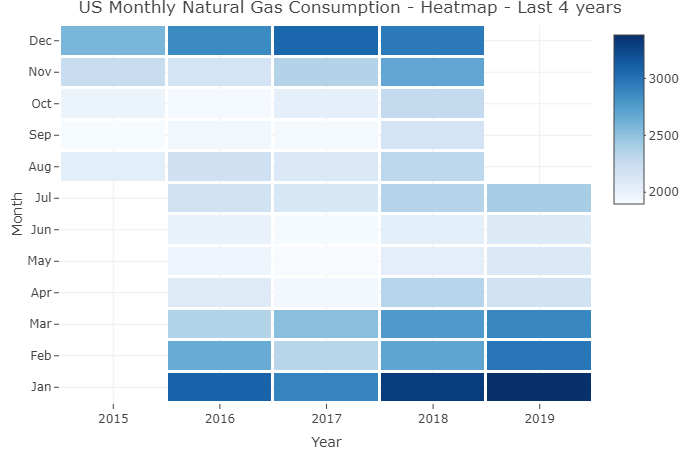
デフォルトの色は青だそうだ。 直近4年といった設定もできるようだ。データ加工をすればいいだけのような気もするが、あると便利なことはあるのかもしれない。
ts_heatmap(USgas, last = 4 * 12, title = "US Monthly Natural Gas Consumption - Heat-map - Last 4 years")
ACFとPACF
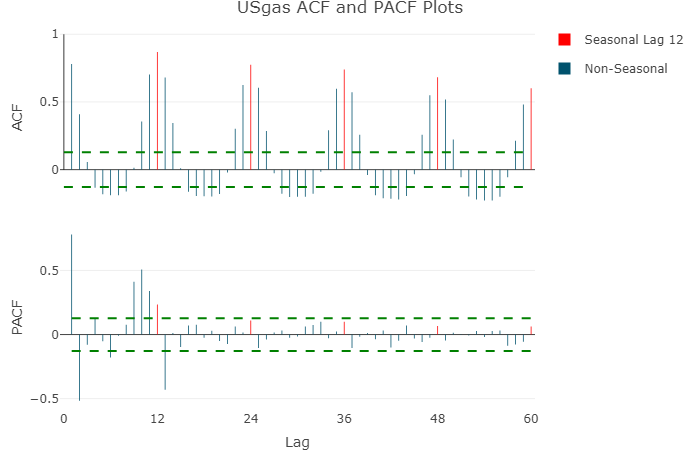
自己相関(ACF, autocorrelation function)と偏自己相関(PACF, partial autocorrelation function)のグラフも出力できる。
ts_cor(USgas, lag.max = 60)
ラグプロット
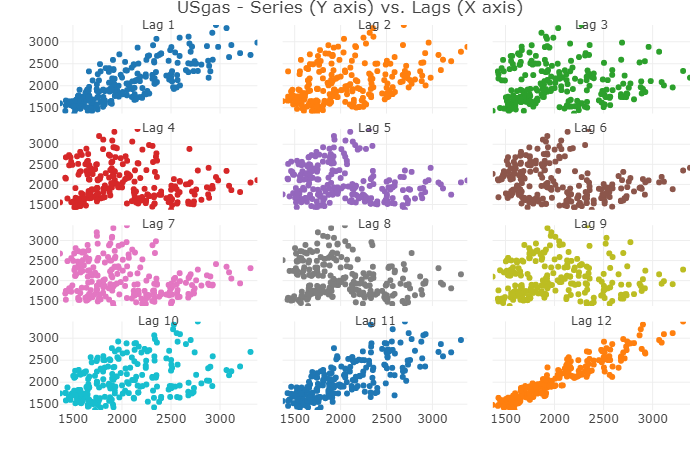
ts_lags(USgas, lags = 1:12)
予測モデル
トレーニングセットとテストセットに分割する。
USgas_s <- ts_split(ts.obj = USgas, sample.out = 12)
train <- USgas_s$train
test <- USgas_s$test
トレーニングセットに2018年の7月までのデータが入り、テストセットに2018年8月2019年7月までの1年分のデータが格納されている。
auto.arima関数を使った予測
library(forecast)
md <- auto.arima(train)
fc <- forecast(md, h = 12)
実際の2000-2019年のデータ(分割前のフルデータ)とトレーニングセットからの推測を並べてプロット。
test_forecast(actual = USgas, forecast.obj = fc, test = test)
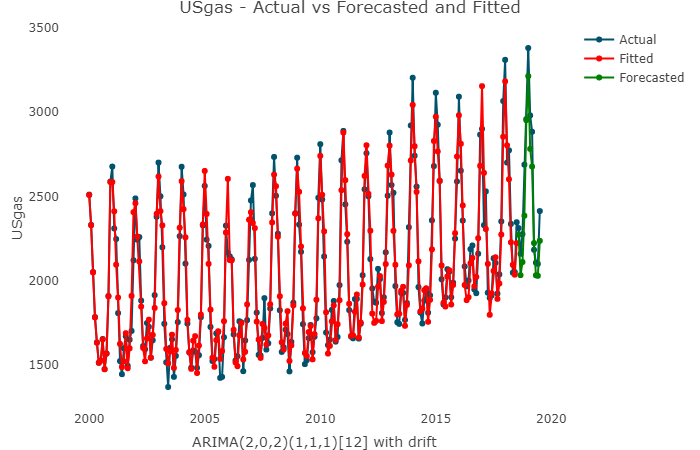
2018-2019期が緑のForecastとして表示されている。
予測値に着目して、もう少しわかりやすくプロットしたのがこちら。
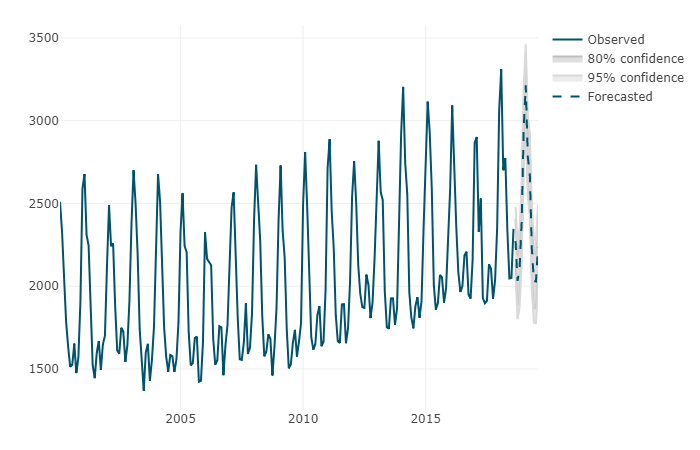
plot_forecast(fc)
